Ethereum Price Analysis: ETH Poised For Rebound To $360
Ethereum price retests support at $310 twice in September. A double-bottom pattern in the 4-hour range predicts recovery to $360 in the near term. After trading highs of $489 at the beginning of September, the smart contract token has tested support at $310 twice. Recovery has been capped under $400 with Ether suffering rejection at The post Ethereum Price Analysis: ETH Poised For Rebound To $360 appeared first on Coingape.

- Ethereum price retests support at $310 twice in September.
- A double-bottom pattern in the 4-hour range predicts recovery to $360 in the near term.
After trading highs of $489 at the beginning of September, the smart contract token has tested support at $310 twice. Recovery has been capped under $400 with Ether suffering rejection at $390 severally. The recent slump saw Ethereum dive below key support areas at $380, $360, and $340. The unstoppable declines continued to $310 before a reversal came into the picture.
At the time of writing, Ethereum is trading at $323 even as bulls rush to take back control in a bid to stop losses from extending below the critical $310. Note that if ETH dips below $300, the price could explore lows towards $250 before a significant correction comes into the picture.
A double-bottom pattern has been spotted on the 4-hour chart. If the pattern is confirmed, Ethereum could be on the verge of a significant correction. Double-bottom patterns highlight areas of demand and are often used in technical analysis to predict reversal points and the extent to which the incoming bullish momentum will go. However, it is essential to realize that double-bottom patterns must be used with other technical indicators to validate the upward movement in the price.
Read also: Ethereum’s Accumulation Trend Remains Unfazed by Price Downturn
ETH/USD 4-hour chart
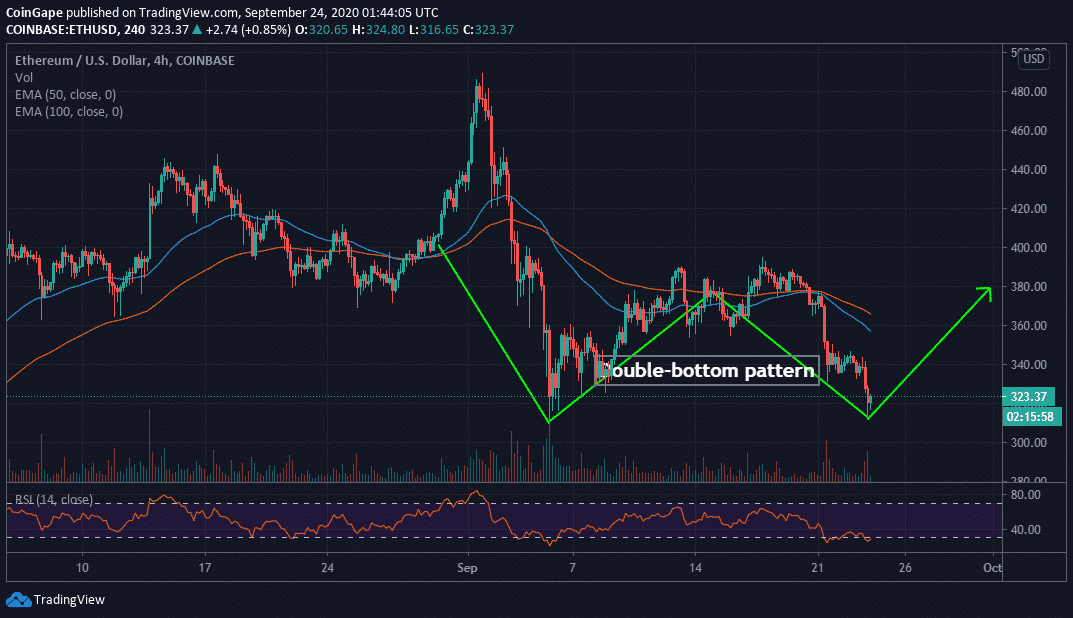
The ongoing bullish momentum is supported by the Relative Strength Index (RSI) as it recovers from the oversold region. Similarly, IntoTheBlock’s IOMAP shows a lack of a formidable supply area with the power to delay the price action to $360. However, the strongest seller congestion zone lies between $362 and $373. Here, near 700,000 addresses previously bought $10.50 million ETH.
ETH IOMAP chart
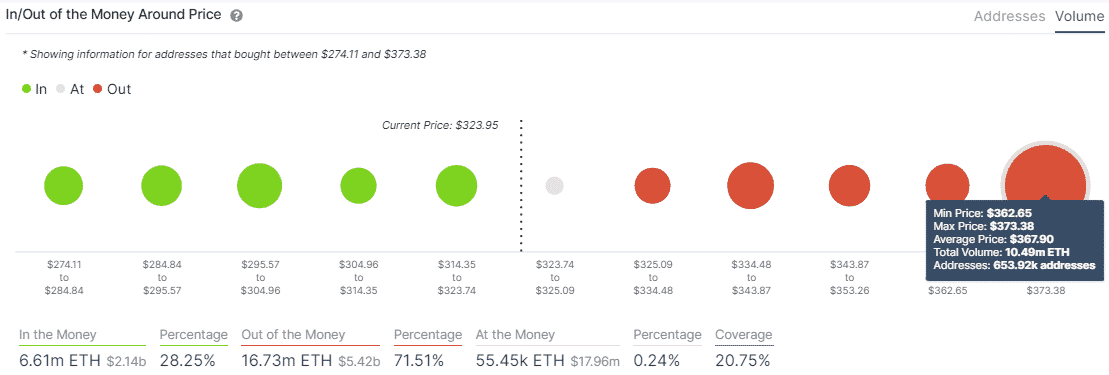
On the flip side, the most critical support holds in the range between $295 and $304. Around 850,000 addresses purchased 1.93 million ETH in the area. In this case, buyers have a task to hold Ethereum above $310 if not $320, and focus on recovery towards the toughest supply area.
Ethereum Intraday Levels
Spot rate: $323
Relative change: 2.93
Percentage change: 0.91%
Volatility: Low
Trend: Bullish
Read more: Ethereum Locked in DeFi Soars to a Fresh ATH
The post Ethereum Price Analysis: ETH Poised For Rebound To $360 appeared first on Coingape.


![Uniswap Token [UNI] Frenzy Commences Following Coinbase & Binance Listings on Launch](../wp-content/uploads/2020/08/31230859/uniswap.jpg)


![Will Uniswap [UNI] Survive The Ongoing Token Outflow?](../wp-content/uploads/2020/09/24205043/sell-key-wo.jpg)