Bitcoin Buying Pressure Increasing as Exchanges Hold More Stablecoins
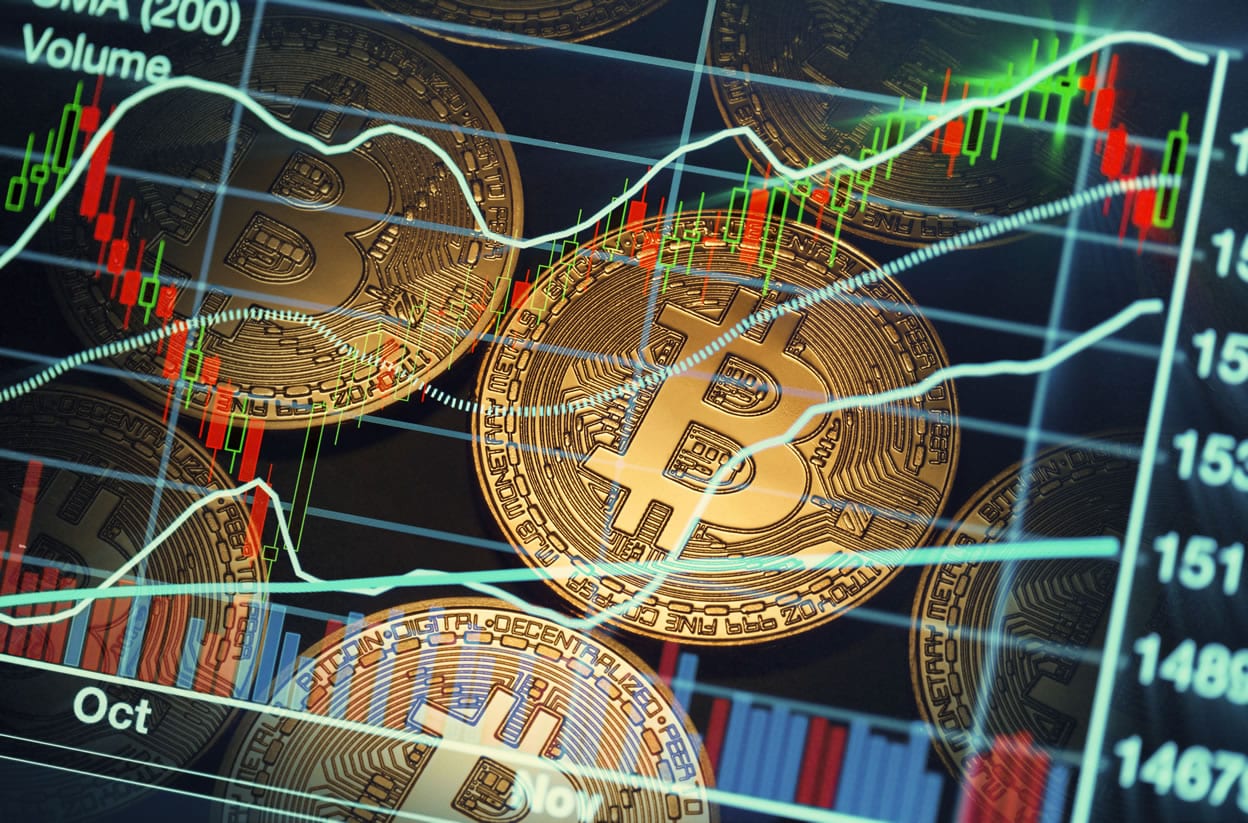
Bitcoin may still be correcting from its 2020 high, but analytics indicate that there is still a lot of buying pressure and the bull run may not be over just yet. Bitcoin prices have been hovering around the $10,250 level for the past three days, down around 17% from their 2020 highs. A weekly candle

Bitcoin may still be correcting from its 2020 high, but analytics indicate that there is still a lot of buying pressure and the bull run may not be over just yet.
Bitcoin prices have been hovering around the $10,250 level for the past three days, down around 17% from their 2020 highs. A weekly candle closing above five figures has been seen as bullish by technical analysts, but exchange data could reveal even more reasons why this rally isn’t over yet.
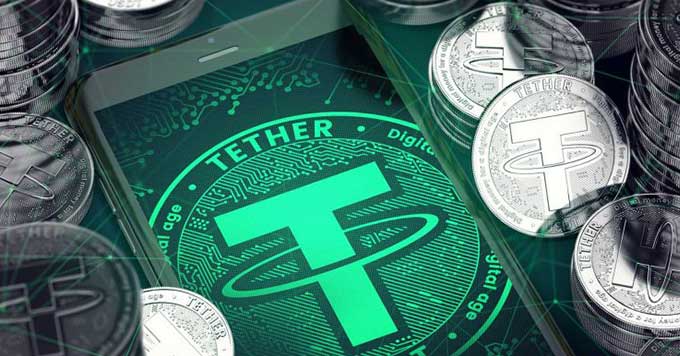
According to on-chain analytics from CryptoQuant, Bitcoin could still have ‘intense buying pressure’ because exchanges are holding more stablecoins and less Bitcoin compared to the beginning of this year. CEO, Ki Young Ju (@ki_young_ju), posted the findings;
#BTC still have intense buy pressure. Exchanges are holding more #stablecoins and fewer #BTC compared to the beginning of this year.
I think we still have room for #BTC bullish trend. (Disclaimer: People can buy other coins with stablecoins tho)https://t.co/ONpGJoy840 pic.twitter.com/Zrh1RdFXc3
— Ki Young Ju (@ki_young_ju) September 7, 2020
He added that the top three crypto exchanges holding Tether are Binance, Huobi, and OKEx, and interestingly, each of them has their own stablecoins – BUSD, HUSD, and USDK respectively. This has resulted in their reserves of BTC declining but is also indicative of crypto investors holding on to the asset for longer.
On the flip side, a continuation of the current correction following the magnitude of pullbacks in previous years could send prices 35% down which would result in a fall to $8,000 as pointed out by trader Rekt Capital (@rektcapital);
If we look at bull market retraces dating back to 2016…
The average correction is -35%
So far, Bitcoin has retraced -21%
A -35% retrace would mean price would fall to $8,000$BTC #Bitcoin
— Rekt Capital (@rektcapital) September 7, 2020
Stock to Flow Update
Looking at the bigger picture, ‘Plan B’s’ stock to flow prediction model, which calculates prices based on scarcity, is still on track. An update to this highly referenced model shows that the long term 200 week moving average is constantly increasing, currently at a rate of $200 per month. He added that the price of Bitcoin has never closed below this indicator.
#Bitcoin 200 week moving average at $6600 and increasing ~$200 per month. BTC 200WMA never goes down. BTC monthly close has never been below 200WMA. Note BTC $1000 struggle in March 2017. pic.twitter.com/a3VlXoY3z2
— PlanB (@100trillionUSD) September 7, 2020
It was suggested after looking at previous market cycles that $10,000 is the new $1,000 in terms of pullback points in the current cycle. The technical analyst elaborated;
“Red dots are monthly closing prices. Currently last red dot is Sep 7 at $10150, not a month close. So red dot has 3 more weeks to get over Aug $11655 close and even if it stays below $11655 at Sep close that has happened before (Mar 2017 and May-Jun 2013).”
The 20-week moving average has also been cited as a good buy in point, and this is exactly where BTC is trading at the moment. At the time of writing, Bitcoin was holding steady just above five figures following its biggest weekly loss since March 2020.