UMA Technical Analysis: UMA On The Cusp Of A Massive breakout Aiming For $15
UMA seeks support following a retreat from October highs traded at $13. The confirmation of a bull flag pattern could send UMA back on the trajectory to $15. UMA impressively broke out over the weekend, following in the Bitcoin’s footsteps towards $12,000. The flagship cryptocurrency brought fresh air into the cryptocurrency industry, culminating in gains The post UMA Technical Analysis: UMA On The Cusp Of A Massive breakout Aiming For $15 appeared first on Coingape.
- UMA seeks support following a retreat from October highs traded at $13.
- The confirmation of a bull flag pattern could send UMA back on the trajectory to $15.
UMA impressively broke out over the weekend, following in the Bitcoin’s footsteps towards $12,000. The flagship cryptocurrency brought fresh air into the cryptocurrency industry, culminating in gains across the board. UMA is among the most improved decentralized finance (DeFi), after accruing more than 27% in gains in the last 24 hours. The DeFi sector is mainly green with assets such as Chainlink, Ren, and Band Protocol performing incredibly well.
Meanwhile, UMA is trading at $8.87 at the time of writing. Although the DeFi token soared in the last 24 hours, the price action is nothing compared to the previous week’s performance. On Friday, UMA/USD extended the bullish move above $10. The gains continued to $13 before a sharp reversal came into the picture.
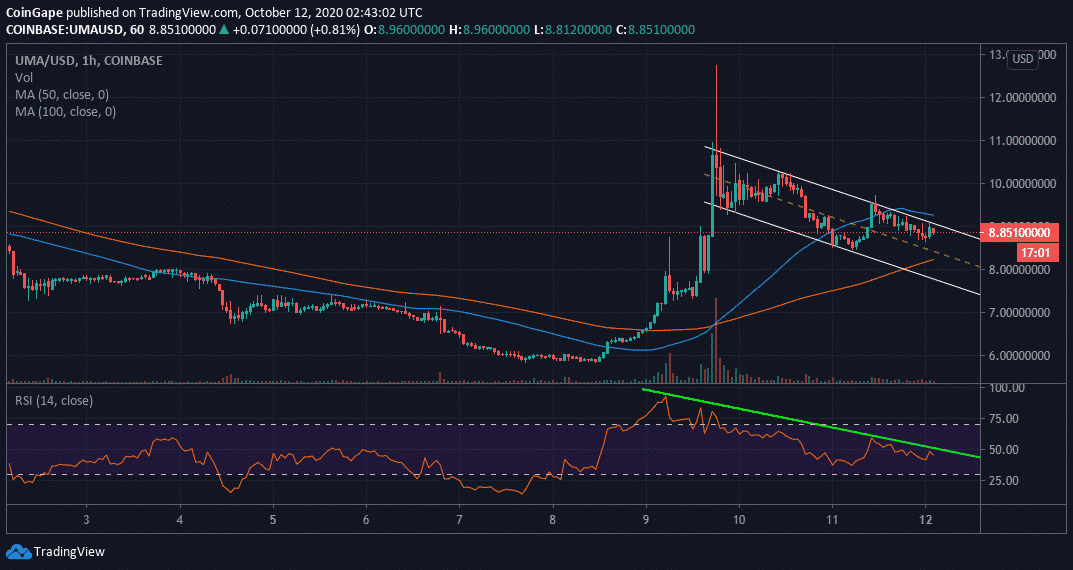
UMA/USD 1-hour chart
Over the last few days, the crypto has lost ground within the confines of a descending channel. Besides, the breakdown was anticipated according to the downward slope of the Relative Strength Index (RSI). Besides the channel resistance, UMA’s upside is capped by 50 Simple Moving Average.
If the descending channel confirms a bull flag, investors can expect a breakout to come into the picture this week. Simultaneously, the breakout will be emphasized by the RSI’s movement above a descending trendline. Other resistance zones to keep in mind include $11, $13, and $15.
UMA Intraday Levels
Spot rate: $8.87
Relative change: 1.1
Percentage change: 1.3%
Trend: Short term bearish bias
Volatility: Low
The post UMA Technical Analysis: UMA On The Cusp Of A Massive breakout Aiming For $15 appeared first on Coingape.